<< back How to drive customer interest with infographic design

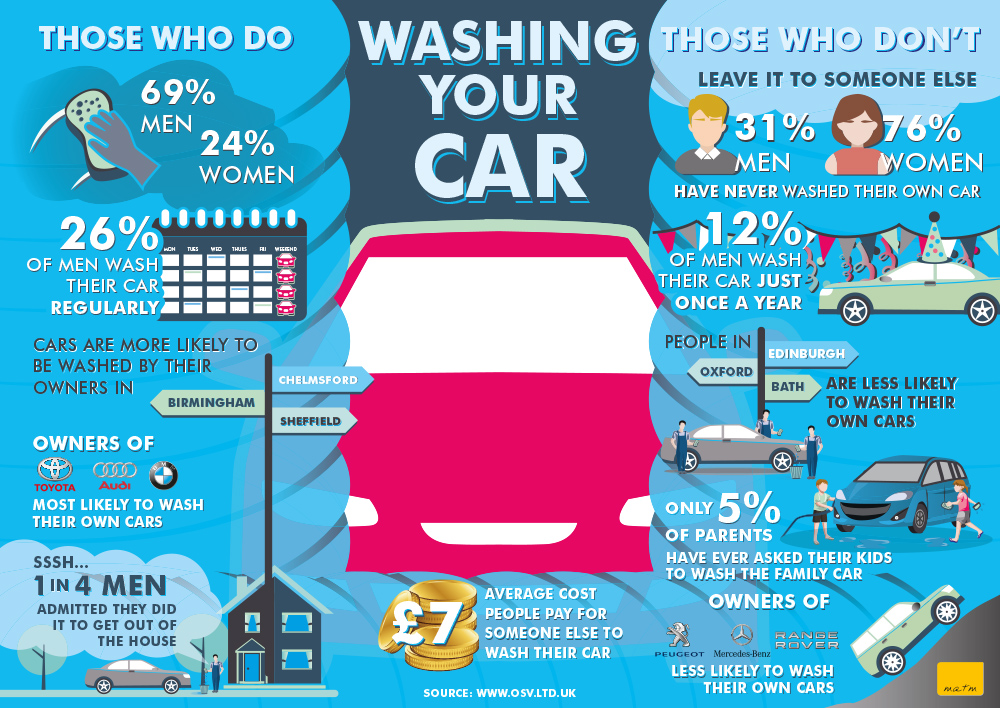
Would you believe it? Owners of Audis are most likely to wash their cars, while owners of Mercedes are least likely.

Men are more than twice as likely as women to wash their cars. And 1 in 4 men wash their cars, just to get out of the house.

Admit it, you are intrigued, even if just a little. It is true, if you present an engaging series of facts, people just can’t help but ponder what they mean. Which is where infographic design come in.

Carwash Infographic

Infographics are an ideal and increasingly popular way to present information bite-sized and attractive chunks. They are good for catching the eye, engaging brain, and getting people talking.

To prove the point, one of our graphic designers, Neil – a bit of a car buff – took his inspiration from research undertaken by OSV limited to find a few interesting figures about car washing.

There is growing demand for engaging factual content on websites and apps, often in list form. Simple facts about what interests people the most are easy to remember, and quickest to be shared.

That is why infographic design is in demand. Infographics are a great way to grab the attention of a target audience. They make key facts about your service easier to understand, more persuasive and more readily shared with business colleagues and friends.

So, it appears keeping up appearances on the driveway is largely a male obsession. Unless you are a Peugeot owner in Oxford, that is. Take a quick look at the infographic to see why.

Click on the image, or download it here to view the graphic in full. If you wanted to talk about infographic design with matm, get in touch. If you want to chat about car shampoos, polishing pads and detailing, talk to Neil.